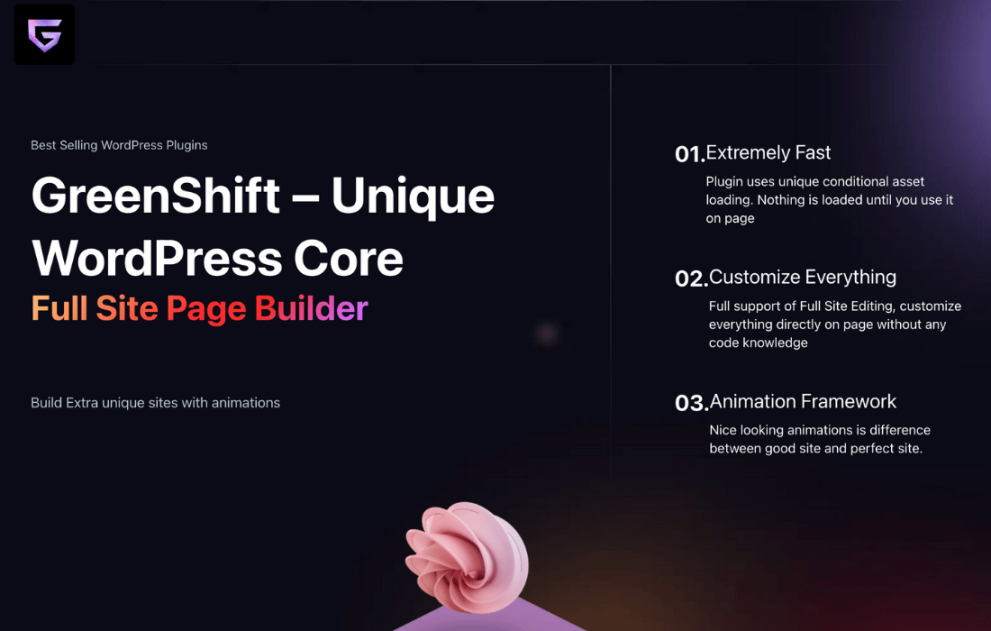
The Greenshift Chart is a specialized premium addon for the Greenshift WordPress plugin. It is designed to create high-performance, interactive data visualizations directly within the Gutenberg editor using the ApexCharts library.
This is EXACTLY the same product as distributed by the developer. Sales Page
Note: This Product is Activated.
The plugin includes over 20 presets, covering the most common data visualization needs:
Standard: Bar (Horizontal/Vertical), Line, Area, and Column charts.
Circular: Pie, Doughnut, and Radial Bar charts.
Specialized: Radar, Scatter, Heatmap, and Bubble charts.
Mixed: Ability to combine different types (e.g., Line and Column) in a single chart.
| Feature | Details |
| Engine | Based on the ApexCharts.js framework. |
| Data Format | Supports JSON (raw data editing) and manual UI input. |
| Performance | Uses Conditional Asset Loading (only loads scripts when a chart is on the page). |
| Responsiveness | Customizable height and settings for 4 different breakpoints (Desktop, Tablet, Mobile). |
| Export Options | Built-in toolbar for users to download charts as SVG or PNG images. |
One of its strongest suits is how it handles data beyond simple manual entry:
Google Sheets & CSV: You can sync charts with Google Sheets (via a public link) or external CSV files.
Dynamic Loading: If the source CSV or Google Sheet is updated, the chart can automatically refresh on page reload.
API Connector: Can be connected to external APIs to pull real-time data into your visualizations.
Dynamic Attributes: Automatically detects data series (e.g., data-series-0) to map dynamic data to specific chart segments. Customization & Design
Direct JSON Editing: For power users, you can edit the raw JSON data. If the JSON is valid, clicking “Initialize” will render the chart instantly.
Watermarks: Option to add custom watermark images to your charts for branding.
Interaction Layers: Like other Greenshift blocks, charts can be used as triggers for animations or other page interactions.
Styling: Full control over colors, stroke width, markers, data labels, and grid lines without writing CSS.
The Chart block is not in the free version of Greenshift. It is available via:
Chart Addon: Purchased as a standalone premium extension.
All-in-One Pack: Included in the full suite of Greenshift premium plugins.